How to Debug an MCP Server with MCP Inspector (Web, CLI, and TUI)
Your MCP server works in your head, but Claude Desktop says “tool call failed” and gives you nothing else. No stack trace, no request log, no hint whether the server even started. You restart the client, you restart the server, you stare at the same error. This article shows you how to cut that loop short with the official MCP Inspector: point it at your server, see the raw protocol exchange, and find the exact step that breaks.
Quick answer
Launch MCP Inspector with npx @modelcontextprotocol/inspector, point it at your server over stdio or Streamable HTTP, then list tools, call one with test arguments, and read the raw JSON-RPC exchange to find the exact failing step.
The hard part is not launching the Inspector, it is telling a server crash apart from a protocol mismatch, and the JSON-RPC log is the only place that distinction is visible.
Checked on 2026-11-10 against the official Inspector documentation and the Inspector repository on GitHub. Interfaces change fast, so if a menu or label differs, trust the linked page.
Evidence: why the Inspector is the default debugging tool
The Inspector is the reference developer tool for testing and debugging MCP servers, and the project describes it as “interactive developer tooling for testing and debugging MCP servers, in the browser, on the command line, and in the terminal.” One package, @modelcontextprotocol/inspector, ships three clients behind one binary: a web UI, a scriptable CLI, and a terminal UI. All three share the same core, so a connection behaves identically across them, including the same transports, the same configuration files, and the same protocol-era negotiation for the 2026-07-28 specification.
Adoption backs that status. As of 2026-11-09, the Inspector repository has 11,261 stars, 1,563 forks, 4,815 commits, and 75 releases, and it has been under active development since October 2024. The current line is v2, with the legacy v1 line kept alive for security fixes only. The Inspector requires Node 22.19.0 or newer and runs directly through npx, with no installation step. We ran version 2.14.0 on Node 24.22.1 for this article and verified the CLI commands below against the official server-everything demo server.
If you are still building your first server, read how to build an MCP server in Python or how to build an MCP server in TypeScript first, then come back here to debug it. If your server is finished and you want to ship it, see how to publish an MCP server to the MCP Registry.
Prerequisites
- Node.js 22.19.0 or newer. Check with
node --versionbefore you start. - A server to debug: a local command that launches one over stdio, or a reachable HTTP URL for a remote server.
- For a remote server behind auth, a token you can paste into a header. Never paste a production secret into a shared screen.
- Optional:
jqfor scripting CLI output in CI.
Step 1: Check your Node version
The Inspector refuses to run on old Node, and the error does not always say why. Verify first:
node --version
# v24.22.1
Anything at or above 22.19.0 works. If you use nvm, run nvm use 22 or newer before launching the Inspector.
Step 2: Launch the web UI against a stdio server
For a local server, pass the launch command as the Inspector’s arguments. This example uses the official demo server, which exposes an echo tool and a handful of others:
npx @modelcontextprotocol/inspector mcp-server-everything
The command prints a URL carrying a per-launch API token and opens it in your browser. Set MCP_AUTO_OPEN_ENABLED=false to stop it opening a tab. In the web UI, the left panel lists your server’s tools, resources, and prompts after the handshake. Click a tool, fill in its arguments, and run it. The right panel shows the request and response as raw JSON-RPC, which is where debugging actually happens.
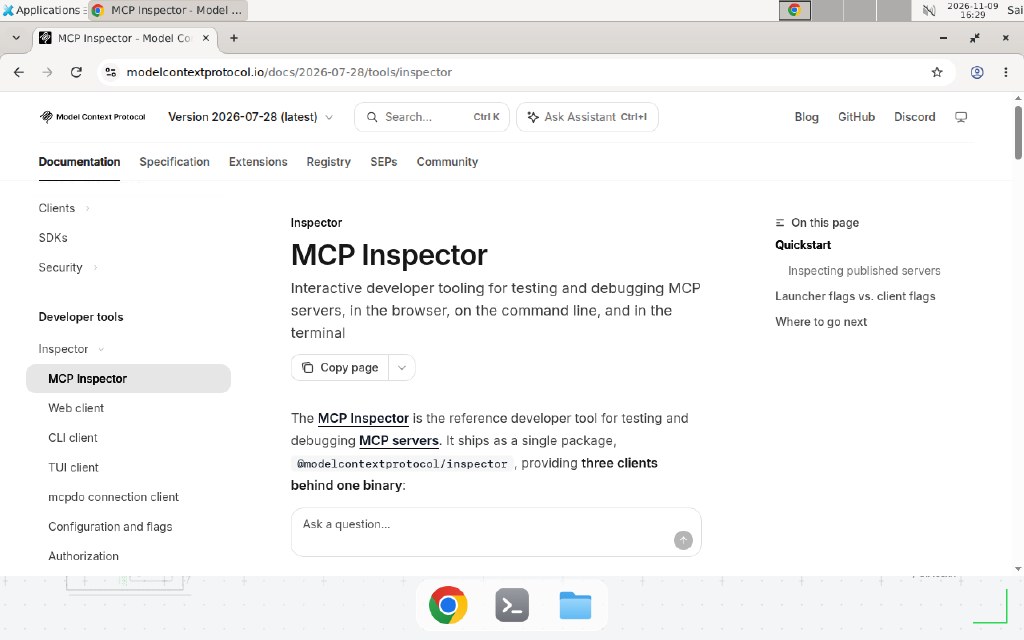
Screenshot: the official MCP Inspector docs (modelcontextprotocol.io), captured 2026-11-10 on the Simular Box cloud computer. The page lists the three clients behind the @modelcontextprotocol/inspector package.
Our own first run hit a real trap: the first npx invocation spent almost a minute downloading packages, and the Inspector gave up after its default 15 second connect timeout with this exact error:
{"error":{"code":"unreachable","message":"Connection timed out after 15000 ms. To accommodate a slower server, pass a larger --connect-timeout <ms>, or set connectionTimeout on the server's catalog or config entry."}}
The server was fine. The download was slow. Once the packages were cached, the same command connected in about two seconds. If you hit this, install the server binary once (npm install -g @modelcontextprotocol/server-everything) or raise the timeout instead of assuming your server is broken.
Step 3: Connect to a remote server over Streamable HTTP
For a server that already runs somewhere, use --server-url. The Inspector auto-detects the transport from the URL: a /mcp path means Streamable HTTP, a /sse path means SSE, and a bare command means stdio.
npx @modelcontextprotocol/inspector --server-url https://example.com/mcp
For a protected server, inject the auth header on the command line:
npx @modelcontextprotocol/inspector \
  --server-url https://example.com/mcp \
  --header "Authorization: Bearer REPLACE_WITH_YOUR_TOKEN"
The URL above is an example. Example — replace with your values. If the server requires OAuth, the web UI walks you through the browser consent flow, and the Inspector keeps the resulting OAuth state on disk so reconnects do not repeat the flow. We could not verify how the web UI renders the OAuth consent screen in this run, because our tests used the CLI against a local server; the vendor docs say the OAuth state is stored on disk and shared across the three clients.
For the transport details behind this step, the MCP transports documentation explains how stdio, Streamable HTTP, and SSE differ, including which one to pick for a local versus a hosted server.
Step 4: List tools, resources, and prompts
Before calling anything, ask the server what it offers. In the web UI, the Tools, Resources, and Prompts tabs call tools/list, resources/list, and prompts/list for you. In the CLI, the same check is one command:
npx @modelcontextprotocol/inspector --cli \
  --connect-timeout 90000 \
  mcp-server-everything --method tools/list
Against the demo server, this returned a JSON list starting with the echo tool, described as “Echoes back the input string”, with an inputSchema requiring a string message. That round trip proves three things at once: the server process started, the initialize handshake succeeded, and the server’s tool schema parses. If tools/list fails, the problem is in startup or the handshake, not in any single tool. If it succeeds but one tool fails, the problem is inside that tool.
Step 5: Call a tool with test arguments
Pick the simplest tool first and call it with known-good arguments. In the CLI:
npx @modelcontextprotocol/inspector --cli \
  mcp-server-everything --method tools/call \
  --tool-name echo --tool-arg message=hello-inspector
A working server returns the echoed string. A broken one returns a structured error, and the error text tells you which layer failed: a JSON-RPC error with code -32602 means your arguments did not match the schema, while a transport error or a timeout means the server died or hung before answering. Fix schema errors in the tool definition, not in the client.
Repeat this for each tool your client actually uses. A server that lists ten tools but crashes on the eleventh is a server that will fail in production at the worst moment.
Step 6: Read the JSON-RPC log, not the pretty view
The web UI shows a formatted result, but the formatted result hides the evidence. Open the request history or monitoring sidebar and read the raw exchange: the initialize request and its protocolVersion, the tools/list response, and the exact tools/call payload your client sent. Compare the params.arguments in the log with the tool’s inputSchema. Most “the tool does the wrong thing” bugs are a client sending {"query": "..."} while the schema expects {"message": "..."}. The log shows that mismatch in seconds. Guessing takes an afternoon.
Step 7: Save the connection in a config file
Repeating long command lines invites typos. The v2 Inspector splits configuration into two files: --config for a read-only session config that is served as-is, and --catalog for a writable catalog that defaults to ~/.mcp-inspector/mcp.json. A minimal session config looks like this:
{
  "mcpServers": {
    "everything-demo": {
      "command": "mcp-server-everything",
      "args": []
    }
  }
}
Launch against it with:
npx @modelcontextprotocol/inspector --config ./inspector-config.json --server everything-demo
Keep this file in your repo next to the server code, minus any secrets. Secrets belong in the OS keychain or in environment variables, never committed. Note the project’s own warning: on a machine with no keychain, such as a headless Linux box or a container, secrets fall back to ~/.mcp-inspector/secrets.json, unencrypted unless you supply a key.
Copy-paste template: a smoke-test script for CI
The CLI is scriptable, so the same checks you run by hand become a regression test. Save this as smoke-test.sh next to your server. It connects, lists tools, calls the echo tool, and fails the build if any step fails:
#!/usr/bin/env bash
# Smoke-test an MCP server with the Inspector CLI.
# Requires: node >= 22.19.0, jq. Replace the server command with your values.
set -euo pipefail

SERVER_CMD="${1:-mcp-server-everything}"
INSPECTOR="npx --yes @modelcontextprotocol/inspector --cli"

echo "== tools/list =="
$INSPECTOR "$SERVER_CMD" --method tools/list --format json \
  | jq -e '.tools | length > 0' > /dev/null

echo "== tools/call echo =="
$INSPECTOR "$SERVER_CMD" --method tools/call \
  --tool-name echo --tool-arg message=smoke-test --format json \
  | jq -e '.content[0].text == "smoke-test"' > /dev/null

echo "Smoke test passed."
Run it with bash smoke-test.sh, or pass your own server command as the first argument. The project documents this same connect, list, call, assert workflow as its recommended smoke test, with --format json plus jq and a documented exit-code map for scripting.
When not to use this / Limits
The Inspector is a debugging tool, not a production monitor. It shows one connection at a time, it does not collect metrics over days, and it does not alert you when a deployed server breaks at 3 a.m. Use real observability for that. It also cannot fix a server that never starts: if your server crashes before the initialize handshake, the Inspector can only report the timeout, and you need the server’s own logs. Finally, do not point the Inspector at a production server with a real user token and start calling tools that send emails, charge cards, or delete data. Test against a staging server or a demo server, and treat every tool call in the Inspector as a real call, because it is one.
Troubleshooting
| Symptom | Likely cause | Command to check | Fix |
|---|---|---|---|
Connection timed out after 15000 ms on first run | npx is still downloading packages, or the server starts slowly | ls ~/.npm/_npx or run the server command alone and time it | Pre-install the server binary, or pass --connect-timeout 60000 |
spawn <command> ENOENT | The server binary is not on PATH | which <command> | Install it globally, or pass the full path, or run through npx -y <package> |
tools/list returns an empty list | Server started but registers no tools, or the wrong server launched | Check the server’s startup log for registration lines | Fix the server’s tool registration, and confirm you launched the right binary |
Tool call fails with code -32602 | Arguments do not match the tool’s inputSchema | Compare params.arguments in the JSON-RPC log with the schema | Correct the argument names and types, then re-run the call |
| Web UI shows a blank page or refuses the token | The per-launch URL expired, or the browser opened a stale tab | Re-run the launch command and use the fresh URL it prints | Copy the new URL from the terminal instead of refreshing the old tab |
| Remote server returns 401 | Missing or expired auth header | Re-run with --header "Authorization: Bearer <token>" and a fresh token | Renew the token, and check the server’s auth docs for the exact header name |
| OAuth flow loops in the browser | OAuth state mismatch or a redirect URI the server rejects | Check the Inspector’s OAuth state on disk and the server’s allowed redirect URIs | Register the Inspector’s redirect URI with the provider, then retry |
Common mistakes
- Debugging the client first. When Claude Desktop reports a tool failure, most people reinstall the client. Run
tools/listin the Inspector first. If it works, the server is fine and the client config is the suspect. If it fails, no client reinstall will help. - Testing only the happy-path tool. The demo echo tool always works. The tool your users call at midnight is the one with the database behind it. Call every tool your client uses, with realistic arguments, before you declare the server healthy.
- Committing secrets in the config file. A
--configfile with a hardcoded token will end up in git. Keep tokens in the keychain or in environment variables passed with-e KEY=VALUE, and keep the config file secret-free. - Trusting the formatted view. The web UI prettifies responses. A tool can return valid-looking text while sending a malformed schema or an extra field the client ignores. Read the raw JSON-RPC at least once per tool.
Test before you rely on it
Run this checklist before you tell anyone the server is debugged:
-
tools/listreturns every tool you expect, with no missing entries. - Each tool you ship passes a
tools/callwith realistic arguments, not just the echo demo. - A bad argument returns a clear
-32602error instead of a crash or a hang. - The server survives a restart and reconnects without manual steps.
- Secrets live in the keychain or environment variables, not in a committed config file.
- The smoke-test script in this article passes from a clean checkout, so CI catches the next regression.
FAQ
Do I need to install MCP Inspector?
No. Run it through npx with Node 22.19.0 or newer: npx @modelcontextprotocol/inspector. The first run downloads the package, so allow a minute on a slow connection.
Can MCP Inspector debug a remote MCP server?
Yes. Pass --server-url https://your-server.example/mcp and, for a protected server, --header "Authorization: Bearer <token>". The Inspector auto-detects Streamable HTTP from a /mcp path and SSE from a /sse path.
Why does my server time out on first connect?
Two common causes: the first npx download is still running, or your server starts slowly. Pre-install the server binary, or raise the timeout with --connect-timeout 60000 in the CLI.
Does the Inspector store my API keys?
It stores OAuth tokens and stdio env values in the OS keychain when one is available. On a headless Linux box without a keychain, they fall back to ~/.mcp-inspector/secrets.json, unencrypted unless you supply a key.
Web UI, CLI, or TUI: which should I use?
Use the web UI for interactive debugging, the CLI for scripted checks and CI, and the TUI when no browser is available. All three share the same core, so a connection behaves identically in each.
Can I use MCP Inspector in CI?
Yes. The CLI accepts --method, --tool-name, and --format json, exits non-zero on failure, and pairs with jq for assertions. That is the smoke-test recipe the project documents.
Conclusion
MCP Inspector turns “the tool call failed” into a visible protocol exchange you can read line by line. Start with tools/list to prove the server is alive, call each tool with realistic arguments, and read the raw JSON-RPC log when the formatted view looks fine but the client disagrees. Keep the smoke-test script in your repo so the next regression fails in CI instead of in front of a user.
If this flow fails at 3 a.m., can your team see what happened and undo it? If not, add logging and a human review step first. Next, read how to build an MCP server in Python to build the server you just learned to debug, or the MCP Tasks tutorial to add long-running async operations to it.
Frequently asked questions
Do I need to install MCP Inspector?
No. Run it through npx with Node 22.19.0 or newer: npx @modelcontextprotocol/inspector. The first run downloads the package, so allow a minute on a slow connection.
Can MCP Inspector debug a remote MCP server?
Yes. Pass --server-url https://your-server.example/mcp and, for a protected server, --header "Authorization: Bearer <token>". The Inspector auto-detects Streamable HTTP from a /mcp path and SSE from a /sse path.
Why does my server time out on first connect?
Two common causes: the first npx download is still running, or your server starts slowly. Pre-install the server binary, or raise the timeout with --connect-timeout 60000 in the CLI.
Does the Inspector store my API keys?
It stores OAuth tokens and stdio env values in the OS keychain when one is available. On a headless Linux box without a keychain, they fall back to ~/.mcp-inspector/secrets.json, unencrypted unless you supply a key.
Web UI, CLI, or TUI: which should I use?
Use the web UI for interactive debugging, the CLI for scripted checks and CI, and the TUI when no browser is available. All three share the same core, so a connection behaves identically in each.
Can I use MCP Inspector in CI?
Yes. The CLI accepts --method, --tool-name, and --format json, exits non-zero on failure, and pairs with jq for assertions. That is the smoke-test recipe the project documents.